|
|

BIDS - What's in a bid and why
INTRODUCTION
The dynamic of the game is simple movement and random dice on the game board, Adding Infantry to the European theatre to secure Germany and/or Russia as an example. How and where you place your units is an important part of the game, and the earliest place of units, the bid must be equally important if not more so…
To this end I started this spread sheet because I was interested in analyzing bids in IAAPA – Firstly I enjoy playing the axis. Also I wanted to find the value and type of bid that worked the best for the axis.
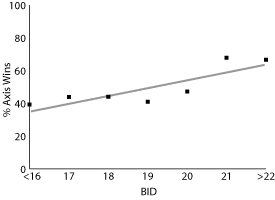
As an example the Ukraine bid can be (in my opinion) Intimidating, but how much bang for the buck does it really have, versus an all Africa bid or an all Japan Asian Bid. The value seems to be consistent and overall, it appears that the point is at just over 20 bid points (20.1 to be precise). The question for me remains however to coin a phrase, where’s the most "Bang for your Bid"
| BID EFFECTIVENESS |
| Overall Bids / #of Games |
449 |
| BID |
Axis
Wins |
Axis
Losses |
Percent Wins |
| < 16 |
48 |
74 |
39.34 % |
| 17 |
25 |
32 |
43.86 % |
| 18 |
44 |
56 |
44.00 % |
| 19 |
25 |
36 |
40.98 % |
| 20 |
34 |
38 |
47.22 % |
| 21 |
19 |
9 |
67.86 % |
| 22 > |
6 |
3 |
66.67 % |
| Total |
201 |
248 |
44.77 % |
|
 |
EXPLANATION
The Following data breaks bids up in to region and type on the board, I have found that consolidated bids can work just as well as a bid that is spread around, but strategy must follow the bid hand in hand for this to work. So I have broken them down as close to specific popular bid/strategies I have observed.
|
The All European Germany Bid |
| BID |
Axis
Wins |
Axis
Losses |
Percent Wins |
| < 16 |
8 |
17 |
32.00 % |
| 17 |
3 |
0 |
100.00 % |
| 18 |
13 |
22 |
37.14 % |
| 19 |
4 |
8 |
33.33 % |
| 20 |
4 |
3 |
57.14 % |
| 21 |
5 |
2 |
71.43 % |
| 22 > |
0 |
0 |
na |
| Total |
37 |
52 |
41.57 % |
|
| Bids with German Navy |
| BID |
Axis
Wins |
Axis
Losses |
Percent Wins |
| < 16 |
9 |
7 |
56.25 % |
| 17 |
7 |
7 |
50.00 % |
| 18 |
3 |
4 |
42.86 % |
| 19 |
1 |
8 |
11.11 % |
| 20 |
7 |
11 |
38.89 % |
| 21 |
0 |
0 |
na |
| 22 > |
1 |
1 |
50.00 % |
| Total |
28 |
38 |
42.42 % |
|
|
The Bids with German Airforce |
| BID |
Axis
Wins |
Axis
Losses |
Percent Wins |
| < 16 |
1 |
1 |
50.00 % |
| 17 |
0 |
0 |
na |
| 18 |
0 |
3 |
0.00 % |
| 19 |
1 |
0 |
100.00 % |
| 20 |
0 |
2 |
0.00 % |
| 21 |
0 |
0 |
na |
| 22 > |
0 |
1 |
0.00 % |
| Total |
2 |
7 |
22.22 % |
|
|
The All Germany Africa Bid |
| BID |
Axis
Wins |
Axis
Losses |
Percent Wins |
| < 16 |
9 |
7 |
56.25 % |
| 17 |
2 |
0 |
100.00 % |
| 18 |
0 |
0 |
na |
| 19 |
0 |
0 |
na |
| 20 |
0 |
0 |
na |
| 21 |
0 |
0 |
na |
| 22 > |
0 |
0 |
na |
| Total |
11 |
7 |
61.11 % |
|
The
Combined Germany, Japan
All Land Bid |
| BID |
Axis
Wins |
Axis
Losses |
Percent Wins |
| < 16 |
14 |
28 |
33.33 % |
| 17 |
9 |
20 |
31.03 % |
| 18 |
23 |
23 |
50.00 % |
| 19 |
13 |
17 |
43.33 % |
| 20 |
22 |
18 |
55.00 % |
| 21 |
10 |
5 |
66.67 % |
| 22 > |
4 |
2 |
66.67 % |
| Total |
95 |
113 |
45.67 % |
|
The All Mainland Japan Bid
|
| BID |
Axis
Wins |
Axis
Losses |
Percent Wins |
| < 16 |
4 |
6 |
40.00 % |
| 17 |
2 |
0 |
100.00 % |
| 18 |
3 |
2 |
60.00 % |
| 19 |
2 |
1 |
66.67 % |
| 20 |
0 |
2 |
0.00 % |
| 21 |
4 |
2 |
66.67 % |
| 22 > |
0 |
0 |
na |
| Total |
15 |
13 |
53.57 % |
|
|
The Bids with Japanese Navy |
| BID |
Axis
Wins |
Axis
Losses |
Percent Wins |
| < 16 |
3 |
7 |
30.00 % |
| 17 |
2 |
4 |
33.33 % |
| 18 |
2 |
2 |
50.00 % |
| 19 |
1 |
1 |
50.00 % |
| 20 |
1 |
2 |
33.33 % |
| 21 |
0 |
0 |
na |
| 22 > |
1 |
0 |
100.00 % |
| Total |
10 |
16 |
38.46 % |
|
|
The Bids with Japanese Airforce |
| BID |
Axis
Wins |
Axis
Losses |
Percent Wins |
| < 16 |
0 |
0 |
na |
| 17 |
0 |
0 |
na |
| 18 |
1 |
0 |
100.00 % |
| 19 |
1 |
0 |
100.00 % |
| 20 |
0 |
0 |
na |
| 21 |
0 |
0 |
na |
| 22 > |
0 |
0 |
na |
| Total |
2 |
0 |
100.00 % |
|
|
The Combined Germany, Japan Navy Bid |
| BID |
Axis
Wins |
Axis
Losses |
Percent Wins |
| < 16 |
0 |
1 |
0.00 % |
| 17 |
0 |
1 |
0.00 % |
| 18 |
1 |
0 |
100.00 % |
| 19 |
2 |
1 |
66.67 % |
| 20 |
0 |
0 |
na |
| 21 |
0 |
0 |
na |
| 22 > |
0 |
0 |
na |
| Total |
3 |
3 |
50.00 % |
|
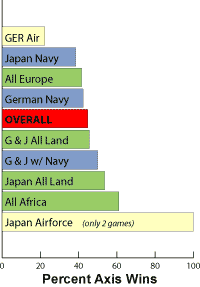
RESULT
The end result of all this data is as follows:
 |
CONCLUSION
My Conclusions are simple, probably because my strategy is simple ; )
I think a player should draw their own conclusions from the data, it is fair to say that the game plays similarly over and over again but I have played games that deviated from this frequently and have enjoyed them immensely. I have used the data and looked at the game trying to put together and overall strategy that is a little different but that works well for me to increase the enjoyment and performance of my game. I hope to have future updates of this spread sheet in the future, more games paints a better picture and a picture is worth a thousand words.
I hope you find the data useful in your quest for the perfect bid.
By Solar
Solarflares@earthlink.net
|


