| The All European Germany Bid |
| BID |
Axis
Wins |
Axis
Losses |
Percent Wins |
| < 16 |
8 |
20 |
28.57 % |
| 17 |
8 |
3 |
72.73 % |
| 18 |
34 |
47 |
41.98 % |
| 19 |
17 |
16 |
51.52 % |
| 20 |
9 |
7 |
56.25 % |
| 21 |
8 |
4 |
66.67 % |
| 22 > |
1 |
0 |
100 % |
| Total |
85 |
97 |
46.70 % |
|
| Bids with German Navy |
| BID |
Axis
Wins |
Axis
Losses |
Percent Wins |
| < 16 |
12 |
13 |
48.00 % |
| 17 |
10 |
12 |
45.45 % |
| 18 |
4 |
5 |
44.44 % |
| 19 |
3 |
8 |
27.27 % |
| 20 |
9 |
12 |
42.86 % |
| 21 |
0 |
0 |
na |
| 22 > |
1 |
1 |
50.00 % |
| Total |
39 |
51 |
43.33 % |
|
| The Bids with German Airforce |
| BID |
Axis
Wins |
Axis
Losses |
Percent Wins |
| < 16 |
2 |
2 |
50.00 % |
| 17 |
0 |
0 |
na |
| 18 |
1 |
5 |
16.67 % |
| 19 |
1 |
0 |
100 % |
| 20 |
1 |
2 |
33.33 % |
| 21 |
0 |
0 |
na |
| 22 > |
0 |
1 |
0.00 % |
| Total |
5 |
10 |
33.33 % |
|
| The All Germany Africa Bid |
| BID |
Axis
Wins |
Axis
Losses |
Percent Wins |
| < 16 |
9 |
8 |
52.94 % |
| 17 |
2 |
0 |
100 % |
| 18 |
0 |
0 |
na |
| 19 |
0 |
1 |
0.00 % |
| 20 |
0 |
0 |
na |
| 21 |
0 |
0 |
na |
| 22 > |
0 |
1 |
0.00 % |
| Total |
11 |
9 |
55.00 % |
|
The Combined Germany, Japan
All Land Bid |
| BID |
Axis
Wins |
Axis
Losses |
Percent Wins |
| < 16 |
17 |
36 |
32.08 % |
| 17 |
19 |
40 |
32.20 % |
| 18 |
46 |
54 |
46.00 % |
| 19 |
30 |
41 |
42.25 % |
| 20 |
22 |
32 |
40.74 % |
| 21 |
12 |
8 |
60.00 % |
| 22 > |
4 |
2 |
66.67 % |
| Total |
147 |
213 |
40.83 % |
|
The All Mainland Japan Bid
|
| BID |
Axis
Wins |
Axis
Losses |
Percent Wins |
| < 16 |
4 |
13 |
23.53 % |
| 17 |
2 |
4 |
33.33 % |
| 18 |
4 |
4 |
50.00 % |
| 19 |
4 |
2 |
66.67 % |
| 20 |
1 |
4 |
20.00 % |
| 21 |
4 |
2 |
66.67 % |
| 22 > |
0 |
0 |
na |
| Total |
19 |
29 |
39.58 % |
|
| The Bids with Japanese Navy |
| BID |
Axis
Wins |
Axis
Losses |
Percent Wins |
| < 16 |
3 |
9 |
25.00 % |
| 17 |
2 |
6 |
25.00 % |
| 18 |
2 |
3 |
40.00 % |
| 19 |
2 |
3 |
40.00 % |
| 20 |
4 |
3 |
57.14 % |
| 21 |
0 |
0 |
na |
| 22 > |
1 |
0 |
100 % |
| Total |
14 |
24 |
36.84 % |
|
| The Bids with Japanese Airforce |
| BID |
Axis
Wins |
Axis
Losses |
Percent Wins |
| < 16 |
0 |
0 |
na |
| 17 |
0 |
0 |
na |
| 18 |
1 |
0 |
100 % |
| 19 |
1 |
0 |
100 % |
| 20 |
0 |
0 |
na |
| 21 |
0 |
0 |
na |
| 22 > |
0 |
0 |
na |
| Total |
2 |
0 |
100 % |
|
So what has changed in the tables from last month?
Two types of bids look better now than they did last month. "Power Europe Bid" now has a 46.7% success rate, which is about 5% better than last month's numbers. The "German Air Bid" now has a 33.33% success rate, where last month showed it at a 22.22%.
Three types of bids moved markedly down: the "Combined Bid" dropped about 5 points to 40.83%, the "All Africa Bid" dropped over 6 points to 55%, and the "Mainland Japan Bid" dropped almost 14 points to 39.58%.
The other bid types only drifted slightly if at all.
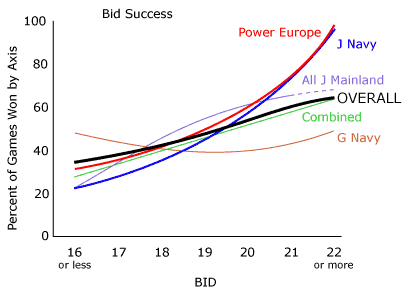
Here is a rough plot of the more popular bid types.

The lines cluster in the 19 - 20 bid range, but widely diverge in the 21 - 22 range. Hmmm . . .
As always: draw your own conclusions, use at your own risk.
Data by Solar, graph and prattle by Airship
|
